How to visualize CSV files using Python

The ability to plot CSV files using Python is important because it enables you to analyze, visualize, and process data efficiently and effectively. This, in turn, facilitates data-driven decision-making and better communication of results.
There are various benefits of using both CSV and Python for analysis:
- Versatility: CSV files are a common format for storing and exchanging structured data. They are used across various industries and applications, making it important to be able to work with them in a popular programming language like Python.
- Data analysis: Python offers powerful libraries for data analysis, such as Pandas, NumPy, and SciPy. By being able to read, process, and plot data from CSV files, you can leverage these libraries to gain insights, perform statistical analyses, and make data-driven decisions.
- Data visualization: Visualization is crucial for understanding complex datasets and identifying patterns, trends, or anomalies. Python provides several libraries for creating plots and visualizations, like Matplotlib, Seaborn, and Plotly. By plotting data from CSV files, you can effectively communicate your findings and present your results in a more digestible way.
- Automation: Python is an excellent choice for automating tasks, including those related to data processing and analysis. By being able to work with CSV files, you can develop scripts to automate repetitive tasks, such as importing data, preprocessing, and generating reports.
- Compatibility: Python is compatible with many platforms and systems, making it an ideal choice for working with CSV files across different environments. Its extensive ecosystem of libraries and tools further enhances its suitability for a wide range of tasks.
We will explore the importance of working with CSV files in Python and discuss three approaches to visualize data using Pandas, Matplotlib, Seaborn, and Plotly. We will discover the benefits and versatility of these powerful libraries while acknowledging that our exploration only scratches the surface of their full capabilities for data visualization.
What is CSV?
A CSV (Comma-Separated Values) file format is a widely used plain-text file format that stores tabular data (numbers and text) in a simple structure. As the name suggests, the values in a CSV file are separated by commas, which act as delimiters. However, other delimiters such as tabs or spaces can also be used in some cases.
Each line in a CSV file typically represents a row of data, and each value separated by a comma corresponds to a cell in that row. The first row often serves as a header, describing the data in each column. CSV files can be opened and edited using spreadsheet software like Microsoft Excel, Google Sheets, or open-source alternatives like LibreOffice Calc.
CSV files are popular because they are easy to create, read, and process. They are often used for data exchange between different applications, importing and exporting data from databases, and as a simple format for storing structured data.
Here's an example of a CSV file with three columns (Name, Age, City) and four rows of data:
Name,Age,City
Alice,30,New York
Bob,25,Los Angeles
Charlie,22,Chicago
How to visualize CSV using Python
I used Pandas in all the examples because it is a widely used and powerful library for data manipulation and analysis in Python. When working with CSV files, Pandas provides an easy-to-use and efficient way to read and process the data, regardless of the visualization library being used.
In each example, Pandas was used to read the CSV file and store the data in a DataFrame object. DataFrames are a convenient and flexible data structure that can easily interact with various visualization libraries like Matplotlib, Seaborn, and Plotly. This seamless interaction makes Pandas a popular choice for initial data handling before visualizing it with different libraries.
Pandas also offers numerous functions for cleaning, transforming, and analyzing data, making it a one-stop solution for many data processing tasks before visualization. By using Pandas, you can ensure that your data is in the right format and structure before creating visualizations with other libraries.
We are using the example CSV content for all examples. Name the file as test_data.csv to run the tests as is.
Visualizing CSV data using Python can be done with several libraries, each offering different approaches and features. The following are three popular libraries for visualizing CSV data in Python.
Matplotlib
Pandas is a powerful data manipulation library, and Matplotlib is a widely used plotting library. You can use them together to visualize data from a CSV file. Here's an example:
import pandas as pd
import matplotlib.pyplot as plt

# Read the CSV file into a Pandas DataFrame
data = pd.read_csv('test_data.csv')

# Plot a histogram of the 'Age' column
data['Age'].plot.hist()
plt.xlabel('Age')
plt.title('Age Distribution')
plt.show()This will plot you

To learn more about Matplotlib visualization go to matplotlib.org.
Seaborn
Seaborn is a statistical data visualization library built on top of Matplotlib. It provides a high-level interface for creating informative and attractive visualizations. Here's an example of visualizing data from a CSV file using Seaborn
import pandas as pd
import seaborn as sns

# Read the CSV file into a Pandas DataFrame
data = pd.read_csv('test_data.csv')

# Plot a scatterplot of 'Age' vs 'Income' columns
sns.scatterplot(data=data, x='Age', y='Income')
plt.title('Income vs Age')
plt.show()This will plot you

To learn more about Seaborn visualization go to seaborn.pydata.org.
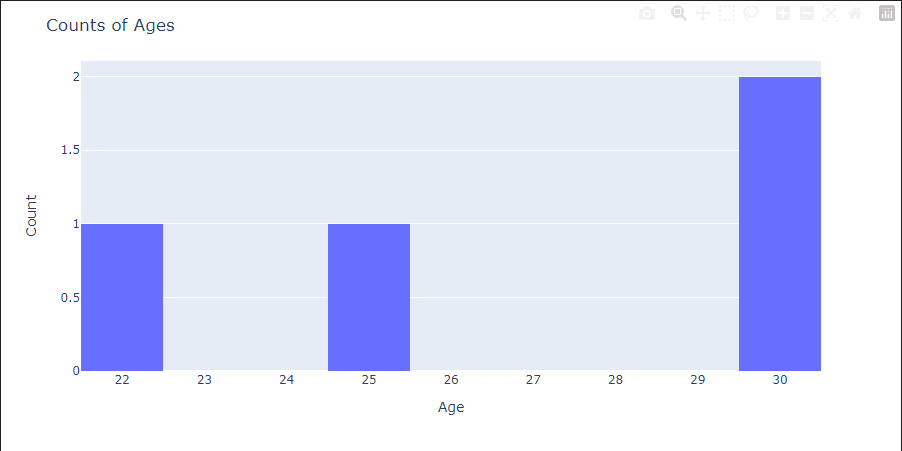
Plotly
Plotly is an interactive plotting library that generates visually appealing and interactive plots. It can be used to visualize data from CSV files as well. Here's an example using Plotly Express
import pandas as pd
import plotly.express as px

# Read the CSV file into a Pandas DataFrame
data = pd.read_csv('test_data.csv')

# Create an interactive bar chart of 'Category' column counts
fig = px.histogram(data, x="Age", nbins=11)
fig.update_layout(title='Counts of Ages', xaxis_title='Age', yaxis_title='Count')
fig.show()
This will plot you
To learn more about Plotly visualization go to plotly.com.
We've only scratched the surface of the visualization capabilities offered by Pandas, Matplotlib, Seaborn, and Plotly. Each library boasts numerous features, customizable options, and a wide array of plot types, enabling users to create powerful and sophisticated visualizations. Our discussion provided a glimpse of their potential, but further exploration of these libraries would reveal even more possibilities for effectively analyzing and presenting complex datasets.
Conclusion
We explored the importance of being able to work with CSV files using Python, particularly in the context of data analysis, visualization, and processing. We highlighted the versatility of Python and its extensive ecosystem of libraries as reasons for its popularity in handling CSV data.
We then discussed three different approaches to visualize CSV data in Python using popular libraries: Pandas with Matplotlib, Seaborn, and Plotly. Each library offers unique features and advantages, catering to different preferences and requirements in data visualization. Pandas was used consistently in all examples to read and process the data from the CSV files, demonstrating their effectiveness in handling data before visualizing it with other libraries.
In conclusion, visualizing CSV data using Python is a valuable skill that enables users to analyze, process, and communicate insights from structured data. The flexibility and power of Python's libraries, such as Pandas, Matplotlib, Seaborn, and Plotly, make it an ideal choice for working with CSV files and creating meaningful visualizations.