How to plot CSV with ParaView

ParaView is a fully-featured visualization software capable of great things. I am showing you how to quickly plot line series from CSV files.
This tutorial is done with ParaView version 5.11. These are all pretty basic features, so they should be quite stable between updates. You can find the example CSV dataset used in the tutorial below.
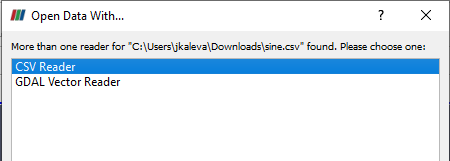
- Open a CSV file from the menu
File -> Open... - From the
Open Data With...dialog chooseCSV Reader
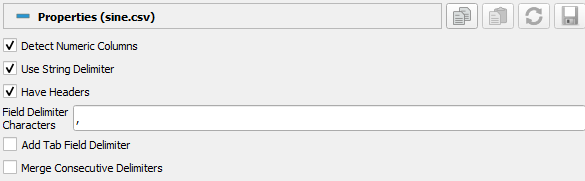
- Check that
Propertiesmatch your CSV format.
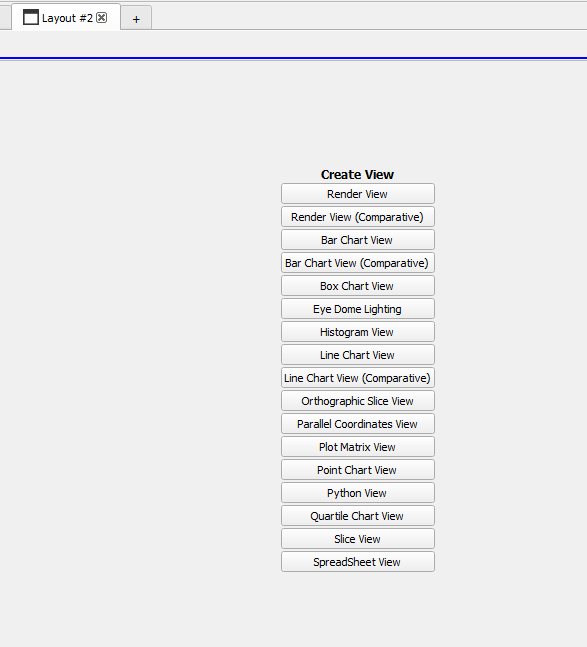
- Create a new layout for visualization by choosing
+and choosingLine Chart View
- Press
Applyto process the CSV content
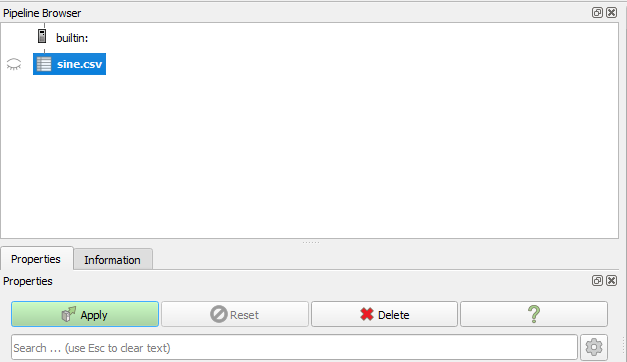
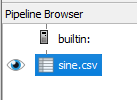
- To show the plot, in
Pipeline Browser, press on the left-hand side of the file name, to toggle theeye.
Now you should see something like this in the layout
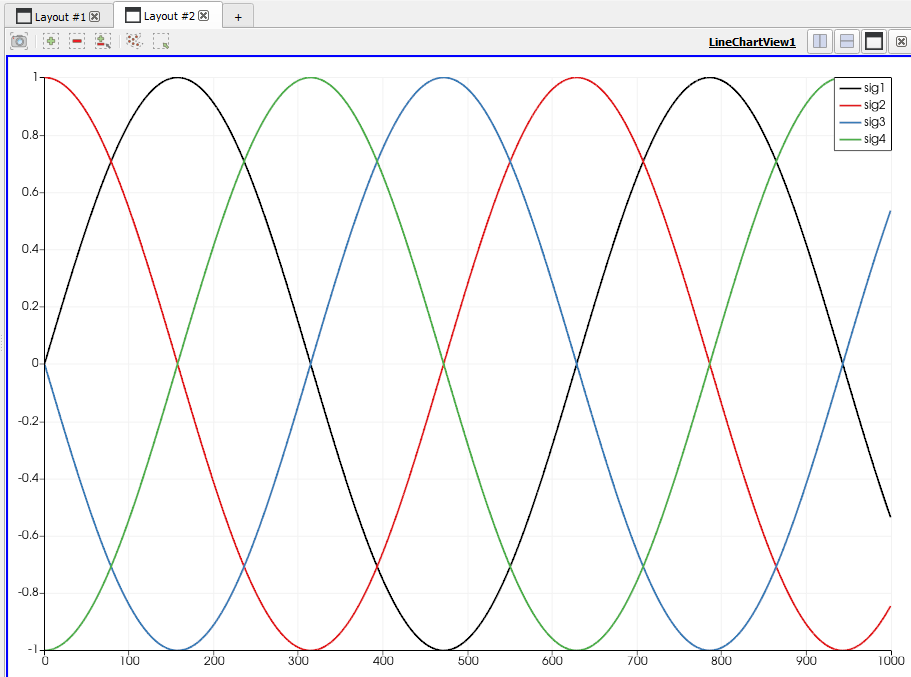
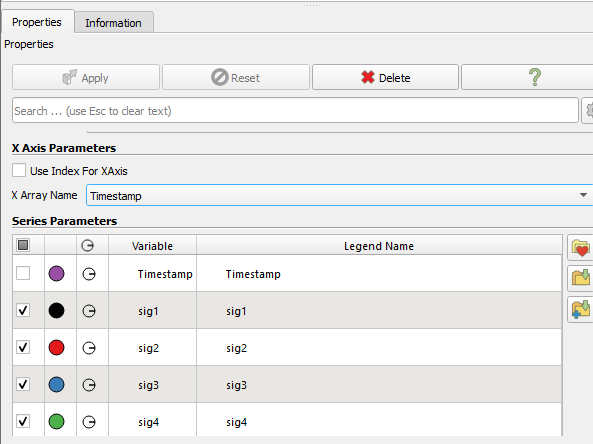
Here, we have the Timestamp column showing up in the graph. What we want is to have Timestamp as the X-axis. To accomplish this, modify the X Axis Parameters.
- Untick
Use Index for XAxis. - Choose the X-axis column, in our case it's
Timestamp. - Untick the corresponding
Series parameterto hide the X-axis data from series parameters
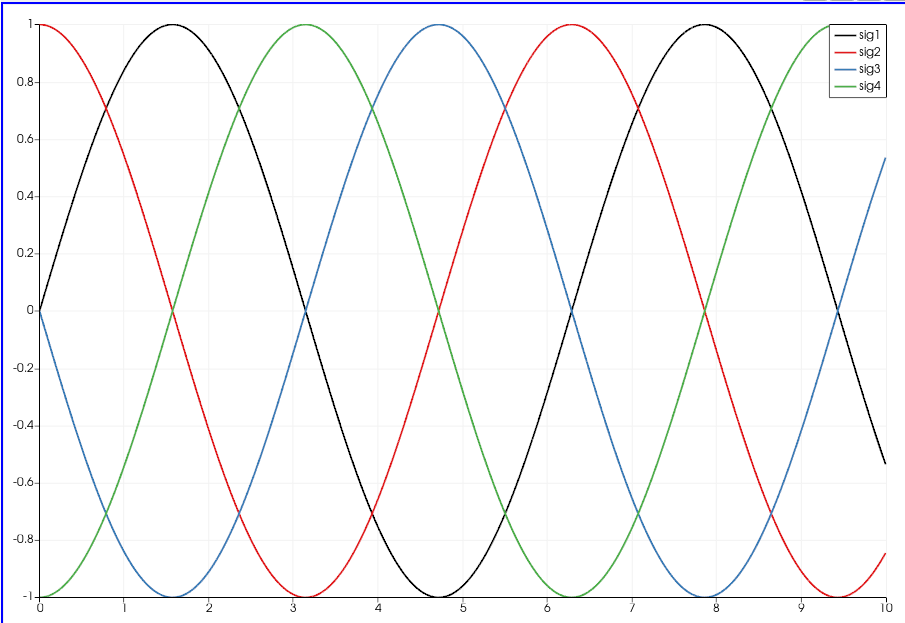
Finally, you should be seeing something like this.
Pro tip: If you have a lot of data, hide the figure by pressing the eye-icon, when you are changing the settings. This prevents reprocessing the figure after every change.
Bonus: data set generation
import pandas as pd
import numpy as np

# Timestamp 10 seconds with 100Hz sampling
timestamp = np.r_[0:1000] * 0.01

# Generate four sine waves with pi/2 phase difference
s1 = np.sin(timestamp)
s2 = np.sin(timestamp + np.pi/2)
s3 = np.sin(timestamp + 2*np.pi/2)
s4 = np.sin(timestamp + 3*np.pi/2)

df = pd.DataFrame({'sig1': s1, 'sig2': s2, 'sig3': s3, 'sig4': s4})
df = df.set_index(timestamp)

df.to_csv('sine.csv', index_label='Timestamp')