Memray memory profiler for Python: initial impression

As a developer, you understand that optimizing your Python code for speed is not always sufficient. The memory usage of your program can become a significant bottleneck, particularly when working with large datasets or complex data structures. Enter Memray, a recent addition to the arsenal of tools available to Python programmers for memory profiling.
Here we provide a first impression of the Memray memory profiler for Python. We will discuss its features, benefits, and potential use cases. Furthermore, we'll look at how it compares to other well-known memory profiling tools and if it can potentially become your new favorite tool.
What is Memray?
Memray is a memory profiler designed explicitly for Python, providing developers with detailed insights into their program's memory consumption. This includes information about total memory usage, memory leaks, and memory usage patterns over time.
One of the standout features of Memray is its user-friendly interface, which presents memory profiling data in an accessible and understandable format. It also offers a CLI (Command Line Interface) for those who prefer to work directly from the terminal.
Getting Started with Memray
Installing Memray is a breeze. It can be installed directly from PyPI using pip:
pip install memray
Once installed, you can start profiling your Python code by importing Memray and using its APIs. Memray provides both a decorator and a context manager, making it easy to profile specific parts of your code. Here's a simple example:
from memray import profile

@profile
def my_function():
    # Your code here
Alternatively, you can use the context manager:
from memray import Memray

with Memray() as m:
    # Your code here
In both examples, Memray will profile the memory usage of the code block and provide a detailed report.
Memray in Action
Let's go through an example of using Memray for profiling a Python script. We'll use a simple script that generates a list of random numbers and sorts it. Here's the Python script (let's call it test_script.py):
import random

def generate_and_sort():
    # Generate a list of 1 million random numbers
    nums = [random.random() for _ in range(10**6)]
    # Sort the list
    nums.sort()

generate_and_sort()
This script generates a list of 1 million random numbers and sorts it. We can use Memray to profile this script and see how much memory it uses.
- Installation: First, we need to install Memray. As per the official documentation, Memray can be installed using pip:
python3 -m pip install memray
- Running the script with Memray: Once Memray is installed, you can run the Python script with Memray using the following command:
python3 -m memray run test_script.py
This command runs the script and generates a binary file (like memray-test_script.2369.bin) that contains the profiling data.
- Generating a flamegraph: You can then generate a flamegraph from the profiling data using the following command:
memray flamegraph test_script.2369.bin
This command generates an HTML file with a flamegraph of the memory usage that you can view in your browser.
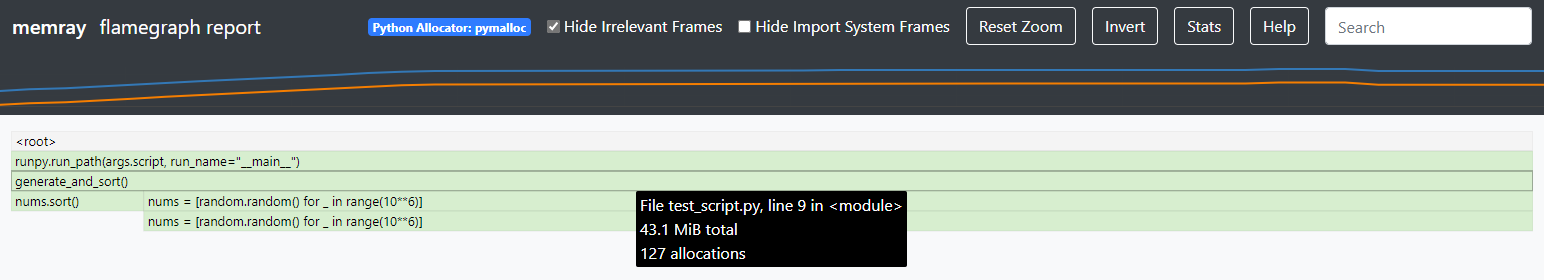
Interpreting the flamegraph: The flamegraph is a visual representation of the memory usage of your script. Each box in the graph represents a function call, and the width of the box represents the amount of memory used by that function. This can help you identify which parts of your script are using the most memory.
Using Memray's API: Memray can also be used programmatically within a Python script. Here's an example of how to use Memray's API:
import memray
import random

def generate_and_sort():
    # Generate a list of 1 million random numbers
    nums = [random.random() for _ in range(10**6)]
    # Sort the list
    nums.sort()

with memray.Tracker("output_file.bin"):
    generate_and_sort()
This script does the same thing as the previous script, but it also uses Memray's API to track the memory usage of the generate_and_sort function.
Keep in mind that Memray is a powerful tool and has many more features and options that you can explore, such as tracking native C/C++ calls, running in live mode for interactive profiling, and integrating with pytest for memory usage testing.
Comparing Memray to Other Python Memory Profilers
There are several other memory profiling tools available for Python, including memory-profiler and objgraph. How does Memray stack up against these competitors?
Here's a quick comparison:
User interface: Memray stands out with its user-friendly interface, presenting data in a clear and understandable way. This contrasts with tools like memory-profiler, which require the user to interpret raw data manually.
Ease of use: With its decorator and context manager, Memray is straightforward to integrate into your Python code. This simplicity could make it a more attractive choice for developers new to memory profiling.
Features: Memray offers a few unique features, such as tracking memory usage over time and identifying exact lines of code responsible for significant memory allocation. While other tools may provide similar features, Memray's implementation seems to be more accessible and intuitive.
First impressions & final remarks
Memray emerges as a powerful, flexible, and efficient tool for profiling memory usage in Python applications. Its ability to trace every function call, handle native calls in C/C++ libraries, generate various reports, and work with both Python and native threads makes it a versatile profiler to have in your toolkit. Whether you're a beginner just starting with Python or a seasoned developer working on complex applications, understanding your code's memory usage can bring significant benefits in terms of performance and resource management.
The installation process is simple, and its usage—whether as a command-line tool or a library within your code—is intuitive and user-friendly. The feature to generate flame graphs provides a visually appealing and easy-to-understand representation of memory usage, and the live mode allows for real-time, interactive profiling.
One limitation to keep in mind is that Memray only works on Linux and MacOS platforms. It is not compatible with Windows or other operating systems. However, for those working in compatible environments, Memray can prove to be an invaluable tool in identifying and resolving memory issues.
It's also worth noting the seamless integration with Pytest via the pytest-memray plugin, which allows for memory profiling in the testing phase, a feature particularly useful for larger applications and test suites.
As we've seen from the examples, Memray can be a game-changer in memory profiling and understanding your Python code's memory footprint. It's a tool that promises to continue improving and evolving, and we're excited to see what future updates will bring. If you're serious about Python development, give Memray a try and see how it can improve your code's performance and efficiency.
References
- The official GitHub repository for Memray, which provides comprehensive information about the tool's features, installation, usage, and more: Memray GitHub
- The Memray documentation, which goes into detail about how to use Memray and its various features: Memray Documentation
- The Pytest plugin for Memray, which allows you to easily use Memray in your test suite: pytest-memray