Measuring Function Execution Time with Perf
In this post, I will show you how to use perf to evaluate function or code block execution time. This requires a bit of effort as perf is essentially a sampling profiler, which collects execution statistics periodically and when specific events occur. As such, perf does not automatically execution time of specific blocks of code or functions.
Sample program
Let's first create a sample application with fairly predictable behavior so that we know what we are looking at in the perf data.
Our sample application has two functions: main and wait. Both functions have simple delay loops. The time spent in the delay loops is relative to ITERATION_COUNTER. The wait function spends the whole ITERATION_COUNTER amount of time in the delay loop, while the main spends half of that.
Both loops are run 4 times. Besides the loops, the main function prints an execution log for each of the 4 execution times.
You can find the complete source below
#include <stdio.h>
#include <unistd.h>

#define ITERATION_COUNTER  100000000

void wait() {
  for (int i = 0; i < ITERATION_COUNTER; i++);
}

int main(int argc, char **argv) {
  for (int i = 0; i < 4; i++) {
    printf("Step %d\n", i);
    fflush(stdout);

    for (int i = 0; i < ITERATION_COUNTER/2; i++);

    wait();
  }

  return 0;
}We compile this by running
gcc -O0 -ggdb3 -fno-omit-frame-pointer simple.c -o simpleFor the sake of simplicity, we disable the optimization flags. -ggdb3 ensures that we have all the debugging info we need and -fno-omit-frame-pointer is there just as a reminder that it should be present when we apply some compiler optimization but still want to do profiling.
Assuming that majority of the time is spent in the delay loops, we should have roughly the following split for the execution times
| function | execution time |
|---|---|
main |
33% |
wait |
66% |
That is, basically, all the time is spent in the delay loops and wait uses twice as much time as main
Basic profiling
It's time to run some very basic profiling to ensure that our program is behaving as we expect
perf record -F1000 -g ./simpleWe sample the program at 1000Hz and include the callgraph (-g). Next, we check how much time, relatively, was spent on each function
perf report -g ./simpleThe result should be something akin to the following
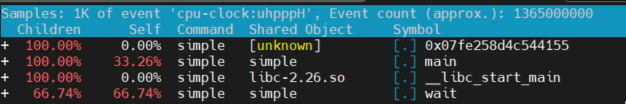
Checking the "self" time reveals that we are indeed spending the time between main and wait as expected.
Computing execution times of the functions
Now, the point of the story was to calculate the execution times of the functions. So far we have verified that our application does what it's supposed to, we can start looking at some absolute numbers.
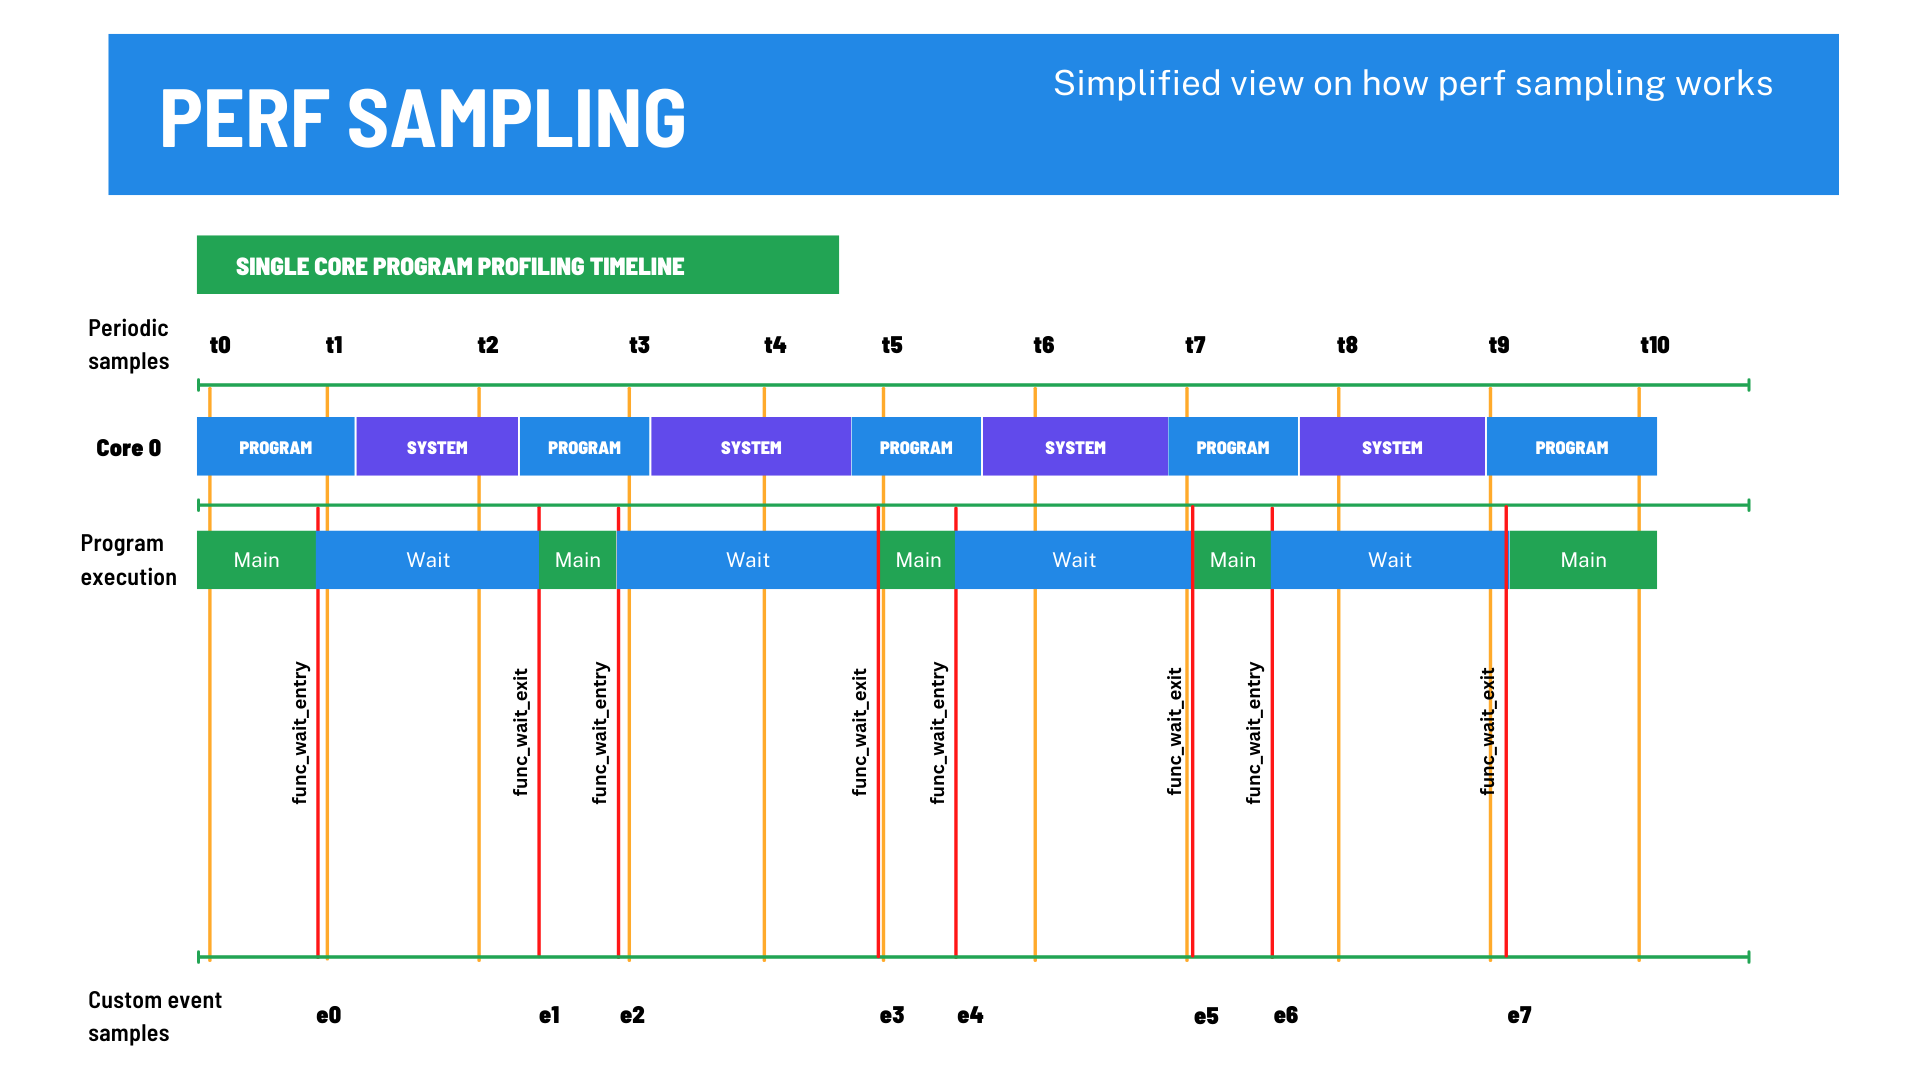
As mentioned before, we cannot get direct execution times of individual functions. What we can get are statistics from supported events and periodic samples.
We will exploit the event tracing by adding user-level probes to the entry and exit points of the desired functions, and then with some post-processing magic, calculate the execution times of those functions.
Before we can add the uprobes, we need to figure out the corresponding symbol names
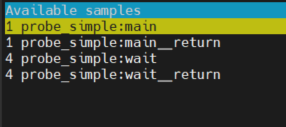
perf probe --list -x ./simpleThis should give you something like this
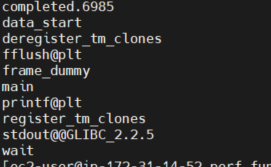
We are interested in the wait and main symbols.
Let's add the probes to the entry and exit points of these functions
sudo perf probe -x ./simple --add main --add main%return --add wait --add wait%returnNotice how just using the symbol name adds the probe to the entry point of the functions. Adding a %return postfix puts the probe into the exit point of the function. Note that you probably need to run probe addition as a privileged user (sudo).
Now, we have the event probes, in place, and we are ready to profile these events
sudo perf record -g -e probe_simple:main -e probe_simple:main__return -e probe_simple:wait -e probe_simple:wait__return ./simpleThis records only the events that we are interested in. We would be expecting something matching the call times of the functions
| function | time called |
|---|---|
main |
1 |
wait |
4 |
Let's make a quick sanity check
sudo perf report -g ./simpleYou should be looking at something like the following
Looks good! Let's proceed to the post-processing phase, where we calculate the actual execution times.
This is the hard part. We need to create a script that goes through all the samples and calculates the relevant statistics. Luckily, perf helps you to get started. By running perf script -g python, perf will create a script template with all events readily in-place.
We will use the pandas library to do some of the heavy liftings for us. Replace the contents of perf-script.py with
import pandas as pd

import os
import sys

sys.path.append(os.environ['PERF_EXEC_PATH'] + \
        '/scripts/python/Perf-Trace-Util/lib/Perf/Trace')

from perf_trace_context import *
from Core import *

# Function statistics
wait_start = 0
wait_exec_duration = [ ]

main_start = 0
main_exec_duration = [ ]

events = pd.DataFrame({})

def trace_end():
    pd.set_option('float_format', '{:f}'.format)

    events = pd.DataFrame({
        'wait': pd.Series(wait_exec_duration),
        'main': pd.Series(main_exec_duration)
    })

    events /=  1e6 # Nanoseconds to microseconds

    print(events.describe())


def probe_simple__main(event_name, context, common_cpu,
    common_secs, common_nsecs, common_pid, common_comm,
    common_callchain, __probe_ip, perf_sample_dict):
    global main_start
    main_start = (common_secs * 1000000000) + common_nsecs


def probe_simple__main__return(event_name, context, common_cpu,
    common_secs, common_nsecs, common_pid, common_comm,
    common_callchain, __probe_func, __probe_ret_ip, perf_sample_dict):
    global main_start, main_exec_duration

    main_end = (common_secs * 1000000000) + common_nsecs

    main_exec_duration += [main_end - main_start]


def probe_simple__wait(event_name, context, common_cpu,
    common_secs, common_nsecs, common_pid, common_comm,
    common_callchain, __probe_ip, perf_sample_dict):
    global wait_start
    wait_start = (common_secs * 1000000000) + common_nsecs


def probe_simple__wait__return(event_name, context, common_cpu,
    common_secs, common_nsecs, common_pid, common_comm,
    common_callchain, __probe_func, __probe_ret_ip, perf_sample_dict):
    global wait_start, wait_exec_duration

    wait_end = (common_secs * 1000000000) + common_nsecs

    wait_exec_duration += [wait_end - wait_start]
This script should be reasonably self-explanatory. When we run this script via perf script the def probe_xxx functions are called for each corresponding event sample. We store the start time of the function in the entry event and calculate the duration in the return event. In the end, trace_end get called, where we combine all event durations into a single pandas data frame and print out the corresponding statistics.
The post-processing script is executed by running
perf script -s perf-script.py The results should show the execution duration statistics for both functions
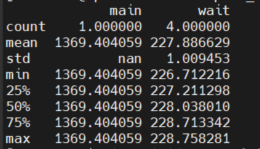
These statistics are in milliseconds. Let's do a final round of sanity-checking. We know that most of the time is spent in the delay loops and that the delay loop within main is half the duration of wait. How does this add up?
Time spent in main
\[
\text{main} = 4 \times \text{wait} + 0.5 \times 4 \times \text{wait} = 6 \times \text{wait} = 6 \times 227.89 = 1367.34
\]
This adds up quite nicely close to the execution time of main.
Summary
While basic profiling with perf is a fairly straightforward process, getting the execution times of specific functions or code blocks and be somewhat involved. When you've done it a few times, you will get a hang of the process. In the end, you should have scripts that make it easy to repeat the measurements, and also you can easily extend the analysis to more advanced statistics.
Further reading
