Decoding Frequencies: An Insight into Spectrograms

Sound is a fascinating phenomenon, a symphony of waves that carry stories, emotions, and information. Whether it's the soothing hum of nature, the bustling cacophony of a city, or the intricate details of a musical performance, there exists a hidden world of frequency and time-based patterns that shape our auditory experiences. But how do we unveil this concealed tapestry and make sense of its intricate patterns? The answer lies in a powerful visualization tool known as the spectrogram.
A spectrogram, at its core, is a visual representation of how frequencies in a sound or other signal evolve over time. Think of it as a bridge that connects the world of sound to the realm of sight, translating complex auditory information into a format that's easy to interpret. By breaking down sounds into their constituent frequencies and displaying their amplitude changes over time, spectrograms offer a deep dive into the nuances of any given audio signal. Whether you're an audiophile, a linguist, a wildlife researcher, or just someone curious about the world of sound, this guide will demystify the principles behind spectrograms and illuminate their practical applications through real-world examples.
What is a Spectrogram?
What is a Spectrogram?
A spectrogram, often referred to as a sonogram, voiceprint, or voicegram, is a visual representation of the spectrum of frequencies in a signal as they evolve over time. In essence, it provides a three-dimensional view of a sound signal, with the three dimensions being time, frequency, and amplitude.
- Time: Represented on the horizontal x-axis, it shows the progression of the signal from its start to its end.
- Frequency: Captured on the vertical y-axis, it illustrates the range of frequencies contained within the signal, from the lowest to the highest.
- Amplitude: Depicted through the color or intensity of the plot, it indicates the strength or loudness of a frequency at a specific point in time.
The beauty of a spectrogram is in its ability to unravel the complex interplay of frequencies in a sound signal. For instance, while a raw sound wave might show peaks and troughs, it doesn't easily reveal the individual frequencies that make up those waves. A spectrogram, on the other hand, breaks down the signal into its constituent frequencies, providing a detailed fingerprint of the sound.
To draw an analogy, consider a bustling market scene. To an observer, it might seem like chaos, a cacophony of voices, and activities. However, a well-tuned ear might discern individual conversations, the distant hum of a radio, or the specific chime of a bell. Similarly, while a waveform representation of a sound gives a broad overview, a spectrogram delves into the intricate details, distinguishing between the myriad of frequencies that coexist and evolve over time.
This detailed representation is made possible through a series of mathematical transformations, most notably the Short Time Fourier Transform (STFT). The STFT divides a continuous sound signal into small chunks or windows and then computes the Fourier Transform for each chunk. This process essentially captures the frequency content of each small segment of the signal, allowing for the detailed visualization we see in a spectrogram.
In the following visualization, you can see that the intensity progresses upwards over time, reflecting the increasing frequency of the sine wave.

- The horizontal axis represents time in seconds.
- The vertical axis represents frequency in Hertz (Hz).
- The color intensity indicates the amplitude of the frequencies. The warmer the color (closer to yellow), the higher the amplitude or intensity at that specific frequency and time.
In practical applications, spectrograms are invaluable. They offer insights into the nature and quality of sound recordings, help in the analysis of speech patterns, facilitate the study of animal vocalizations, and serve numerous other purposes in diverse fields ranging from music production to machinery fault detection.
Spectrogram Music Example:
Imagine a piano being played, progressing from its lowest to highest notes. At the start, you'd see colors or intensities representing the low frequencies of the piano. As the keys are played in succession, moving from the leftmost side (bass) to the rightmost side (treble), the colors or intensities would move upwards on the spectrogram, corresponding to the increasing frequencies of the notes.
The spectrogram would visually represent this as a kind of upward trajectory or curve, with the color intensities changing as the loudness of the notes varies.
\[
\begin{array}{c}
\text{Time} \rightarrow \\
\begin{array}{c|c|c|c|c|c|c|c}
\text{Low Freq.} & & & & & & & \text{High Freq.} \\
\hline
\color{blue}{\text{■}} & & & & & & & \\
\hline
& \color{blue}{\text{■}} & & & & & & \\
\hline
& & \color{blue}{\text{■}} & & & & & \\
\hline
& & & \color{blue}{\text{■}} & & & & \\
\hline
& & & & \color{blue}{\text{■}} & & & \\
\hline
& & & & & \color{blue}{\text{■}} & & \\
\hline
& & & & & & \color{blue}{\text{■}} & \\
\hline
& & & & & & & \color{blue}{\text{■}}
\end{array}
\end{array}
\]
- The horizontal axis represents time.
- The vertical axis represents frequency.
- The blue squares \(\color{blue}{\text{■}}\) depict the loudness of a note being played at that frequency and time. The progression from left to right and bottom to top demonstrates the increasing pitch of the notes being played on the piano.
This is a very simplified example. In a real-world scenario, the spectrogram would contain much more information, including the harmonics of each note and the intricate variations in amplitude and frequency over time.
How is a Spectrogram Constructed?
Constructing a spectrogram is not just about visual representation; it's a journey through mathematical transformations that capture the essence of a sound signal. Let's delve deeper into the process.
1. Dividing the Signal into Chunks:
The first step in constructing a spectrogram is to divide the continuous sound signal into smaller, overlapping segments or "windows." The reason for this is simple: sound signals often change over time, and analyzing them in small chunks allows us to capture these changes in detail.
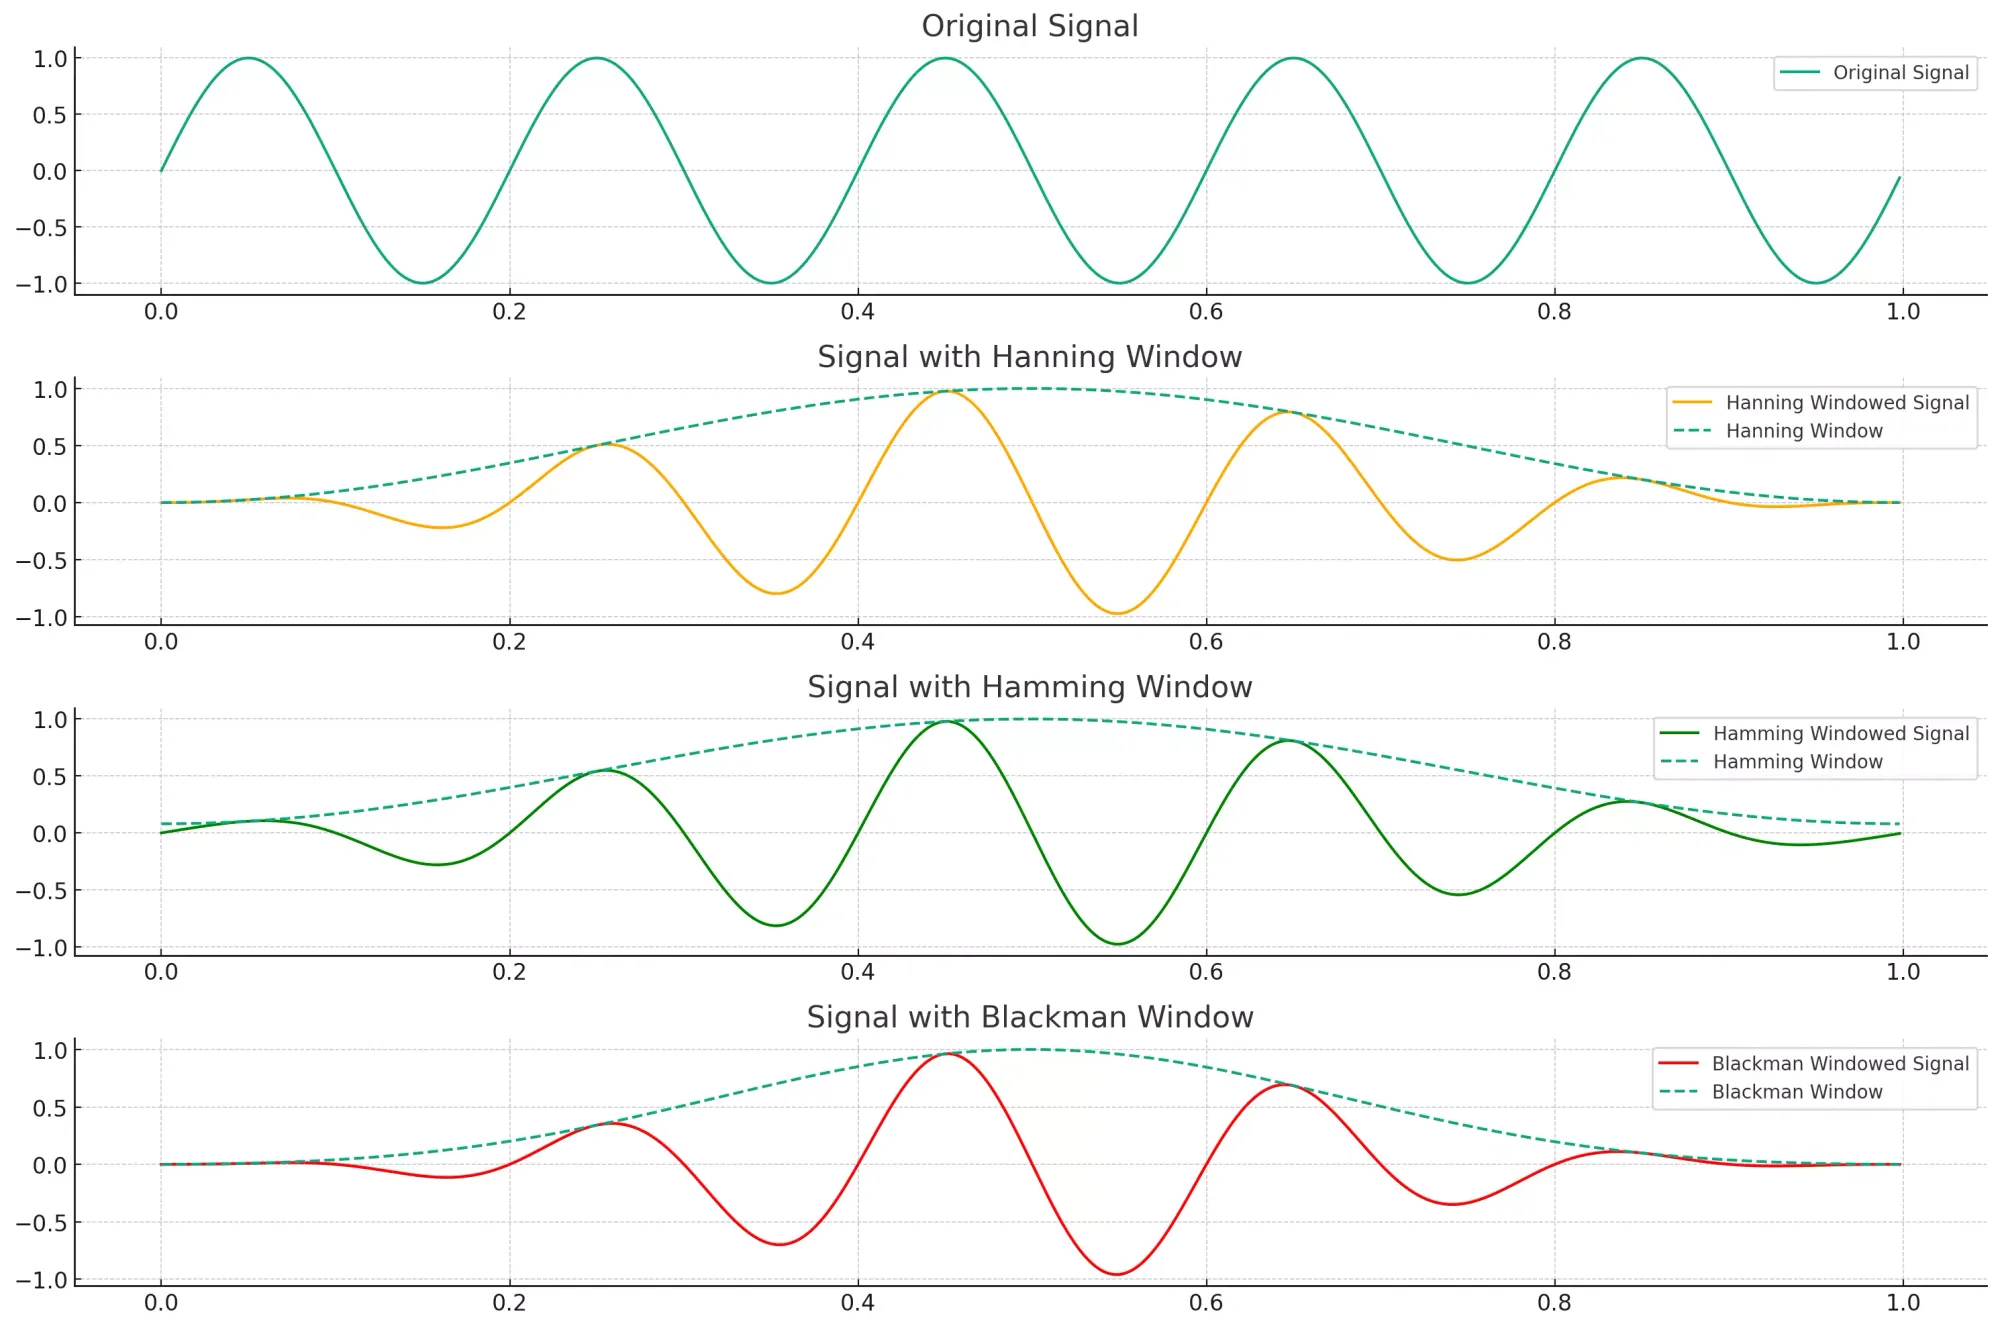
2. Windowing:
Each segment of the signal is then multiplied by a window function. Commonly used window functions include the Hamming, Hanning, and Blackman windows. Windowing serves two primary purposes:
- It minimizes the discontinuities at the beginning and end of each segment.
- It reduces spectral leakage, ensuring that the frequency content of each segment is more accurately represented.
3. Fourier Transform:
For each windowed segment, we apply the Fourier Transform, a mathematical operation that decomposes the segment into its constituent frequencies. The Fourier Transform is a fundamental tool in signal processing. Given a signal \( s(t) \), its Fourier Transform is given by:
\[
S(f) = \int_{-\infty}^{\infty} s(t) e^{-j 2 \pi f t} , dt
\]
However, for our segmented data, we often use the Discrete Fourier Transform (DFT), suitable for discrete sets of data points.
4. Plotting the Spectrogram:
Once we've transformed each segment into its frequency components, we can start plotting the spectrogram. The x-axis represents time, corresponding to the center of each segment. The y-axis represents frequency, from the lowest to the highest frequencies captured. The amplitude of each frequency at each time point is represented through color or intensity on the plot. Typically, darker colors or shades represent lower amplitudes, while brighter colors indicate higher amplitudes.
5. Resolution Considerations:
When constructing a spectrogram, there's a trade-off between time and frequency resolution that one needs to consider:
- If you choose longer segments, you'll get better frequency resolution (the ability to distinguish between close frequencies) but poorer time resolution.
- Conversely, shorter segments offer better time resolution (capturing rapid changes in the signal) but poorer frequency resolution.
This trade-off is crucial, especially when analyzing signals where either rapid temporal changes or detailed frequency analysis is essential.
6. Color Mapping:
The choice of color map can significantly affect the interpretability of the spectrogram. Common color maps like 'viridis' or 'jet' are used, with each color representing a range of amplitude values. It's essential to choose a color map that provides good contrast and is intuitive to the viewer.
In summary, constructing a spectrogram is a blend of art and science. It involves segmenting and transforming the sound signal mathematically and then artistically representing the results in a way that provides meaningful insights into the signal's frequency content over time.
Practical Examples:
- Speech Analysis: In linguistics, spectrograms are invaluable. They allow researchers to see and analyze the harmonic structures in speech, helping in phonetic studies.
- Music Analysis: Musicians and producers use spectrograms to visualize the different instruments' frequencies in a song, helping in mixing and mastering.
- Animal Calls: Biologists utilize spectrograms to study animal vocalizations, and decipher patterns, and communication methods.
- Fault Detection: Engineers employ spectrograms in machinery fault detection. By analyzing the frequency content over time, unusual behaviors can be spotted.
In conclusion
A spectrogram is a powerful tool that bridges the auditory and visual realms, offering insights that are otherwise hidden in the intricate waves of sound signals. As we've seen, its construction isn't just about visual representation; it's a meticulous process of segmenting, windowing, and transforming the sound signal to extract its frequency content at various time intervals. Each step, from the choice of windowing function to the resolution trade-offs, plays a pivotal role in ensuring the accuracy and interpretability of the resultant spectrogram.
Furthermore, the applications of spectrograms are vast and varied, spanning multiple disciplines and industries. From linguists decoding human speech patterns to wildlife researchers deciphering animal vocalizations, from music producers perfecting the mix of a track to engineers detecting faults in machinery through sound analysis – the spectrogram stands as an indispensable tool. As technology advances and our understanding of sound deepens, the spectrogram will undoubtedly continue to play a crucial role, shining light on the beautiful symphony of frequencies that shape our auditory experiences.