How to Perform Perf Profiling in WSL2

In this post, we take a look at what is the status of code profiling using perf on WSL2?
Suppose you are like me, and your company policy forces you to work with Windows-based systems. In that case, Windows Subsystem for Linux (WSL) is likely the most convenient way of making your beloved Linux tools available for daily activities.
Perf is a very robust profiling tool with minimal overhead. This makes it my go-to profiling tool, whenever there is a performance concern that requires more in-depth investigation. The best really thing about perf is that it is generally available for most Linux-based systems, as it is distributed with the kernel.
Installing perf on WSL2
You cannot use perf directly by running it from /usr/bin/perf. This is a wrapper that tries to find perf installation matching your specific kernel version. Since there is no WSL2 linux-tools available in Ubuntu repositories, we rely on generic tools.
sudo apt install linux-tools-genericNow, we have perf binaries available in /usr/lib/linux-tools/<kernel version>/perf. In my case, this is /usr/lib/linux-tools/5.4.0-131-generic/perf.
We can test it by profiling ls as
/usr/lib/linux-tools/5.4.0-131-generic/perf stat lsThis will give us provide us with something like following
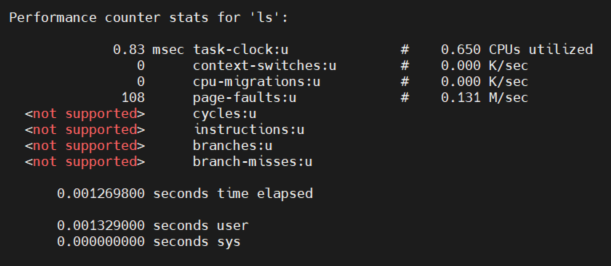
Notice how we have many standard counters that are not supported, like, cycles:u. This is due to WSL2 not supporting hardware counters. This is naturally a major shortcoming and is being worked on by the WSL team.
 microsoft
Profiling with Perf
Let's make a super simple program in C
#include <stdio.h>
#include <unistd.h>

void wait(int ms) {
    usleep(ms * 1000);
}

int main() {
    for (int i = 0; i < 5; i++) {
        printf("Step %d\n", i);
        fflush(stdout);
        wait(100);
    }

    return 0;
}This iterates 5 times through the for loop and on each iteration print out the iteration number and calls wait function. The wait function will induce sleep for 100ms.
To make things even simpler, we will do this without any optimization
gcc -O0 -ggdb3 -fno-omit-frame-pointer -o simple simple.cNot that -fno-omit-frame-pointer is redundant due to -O0, but I've left it there as a reminder. It is always a good practice with perf to not optimize the frame pointers as they are used by default to sample that stack contents. Finally,-ggdb3 provides us with additional information in our perf reports.
Now, we are ready with the simple program. Let's profile it
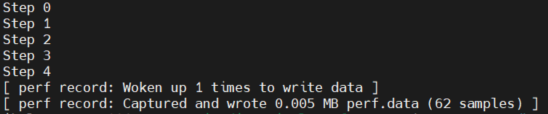
/usr/lib/linux-tools/5.4.0-131-generic/perf record -c 1000 -g ./simpleThis will sample the counters and stack every 1000 cycles and collect the callgraph (-g).
Profiling data
The perf trace is stored in perf.data. This is the default naming for the profiling data and if not otherwise stated, it is used by all perf commands that deal with recorded perf data.
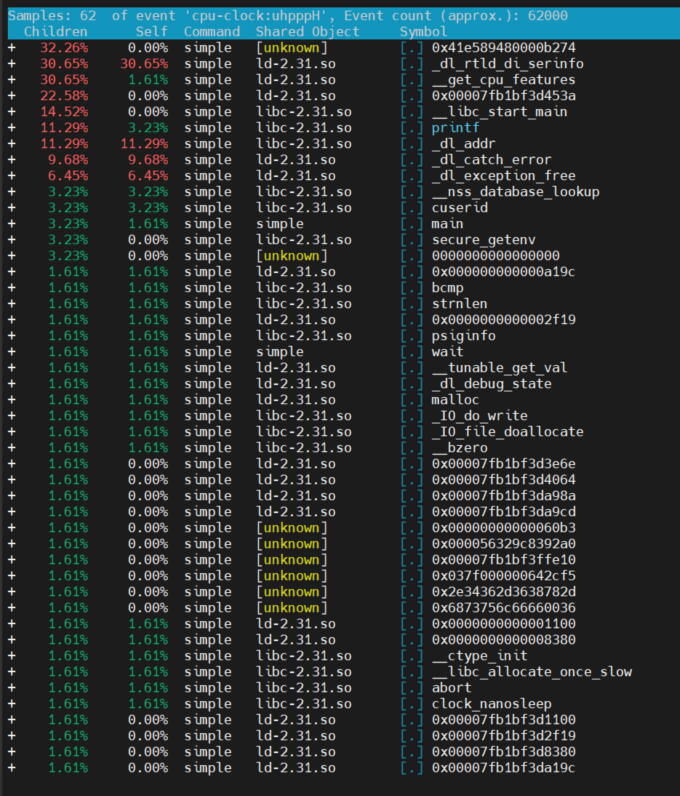
Now that the data is ready, the next step is to have a look at what was recorded. This can be done by running
/usr/lib/linux-tools/5.4.0-131-generic/perf report -gThis will pop up the perf terminal user interface, and serves as a starting point for figuring out where
Summary
Perf on WSL2 is definitely not ready for prime time yet. Missing hardware events makes it hard to do anything more than very basic profiling. Still, there are things that work and there is progress to be expected in the future. In the meanwhile, you may want to look for other profiling tools under WSL2.
Further reading
