How to Calculate Percentile in Python?

Percentiles are among the most common tools for statistical analysis. They are used to determine a number (score) under which a given percentage of samples fall into. For instance, the 50% percentile is essentially the median, the value under which half of the samples fall into.
I will walk through the three most essential and most popular Python libraries in statistics and numerical processing and see how they can be used to calculate Python percentile: numpy, scipy & pandas. Also, I will show you how to calculate Python percentile without any Python external libraries.
Percentile: the definition
First of all, there is no standard definition for percentile. There are 9-10 commonly used ones. However, all of them are designed to show similar behavior. Another widely used name for percentiles is the k-percentile, which highlights that we are looking for a score under which the k-percentage of the samples falls into.
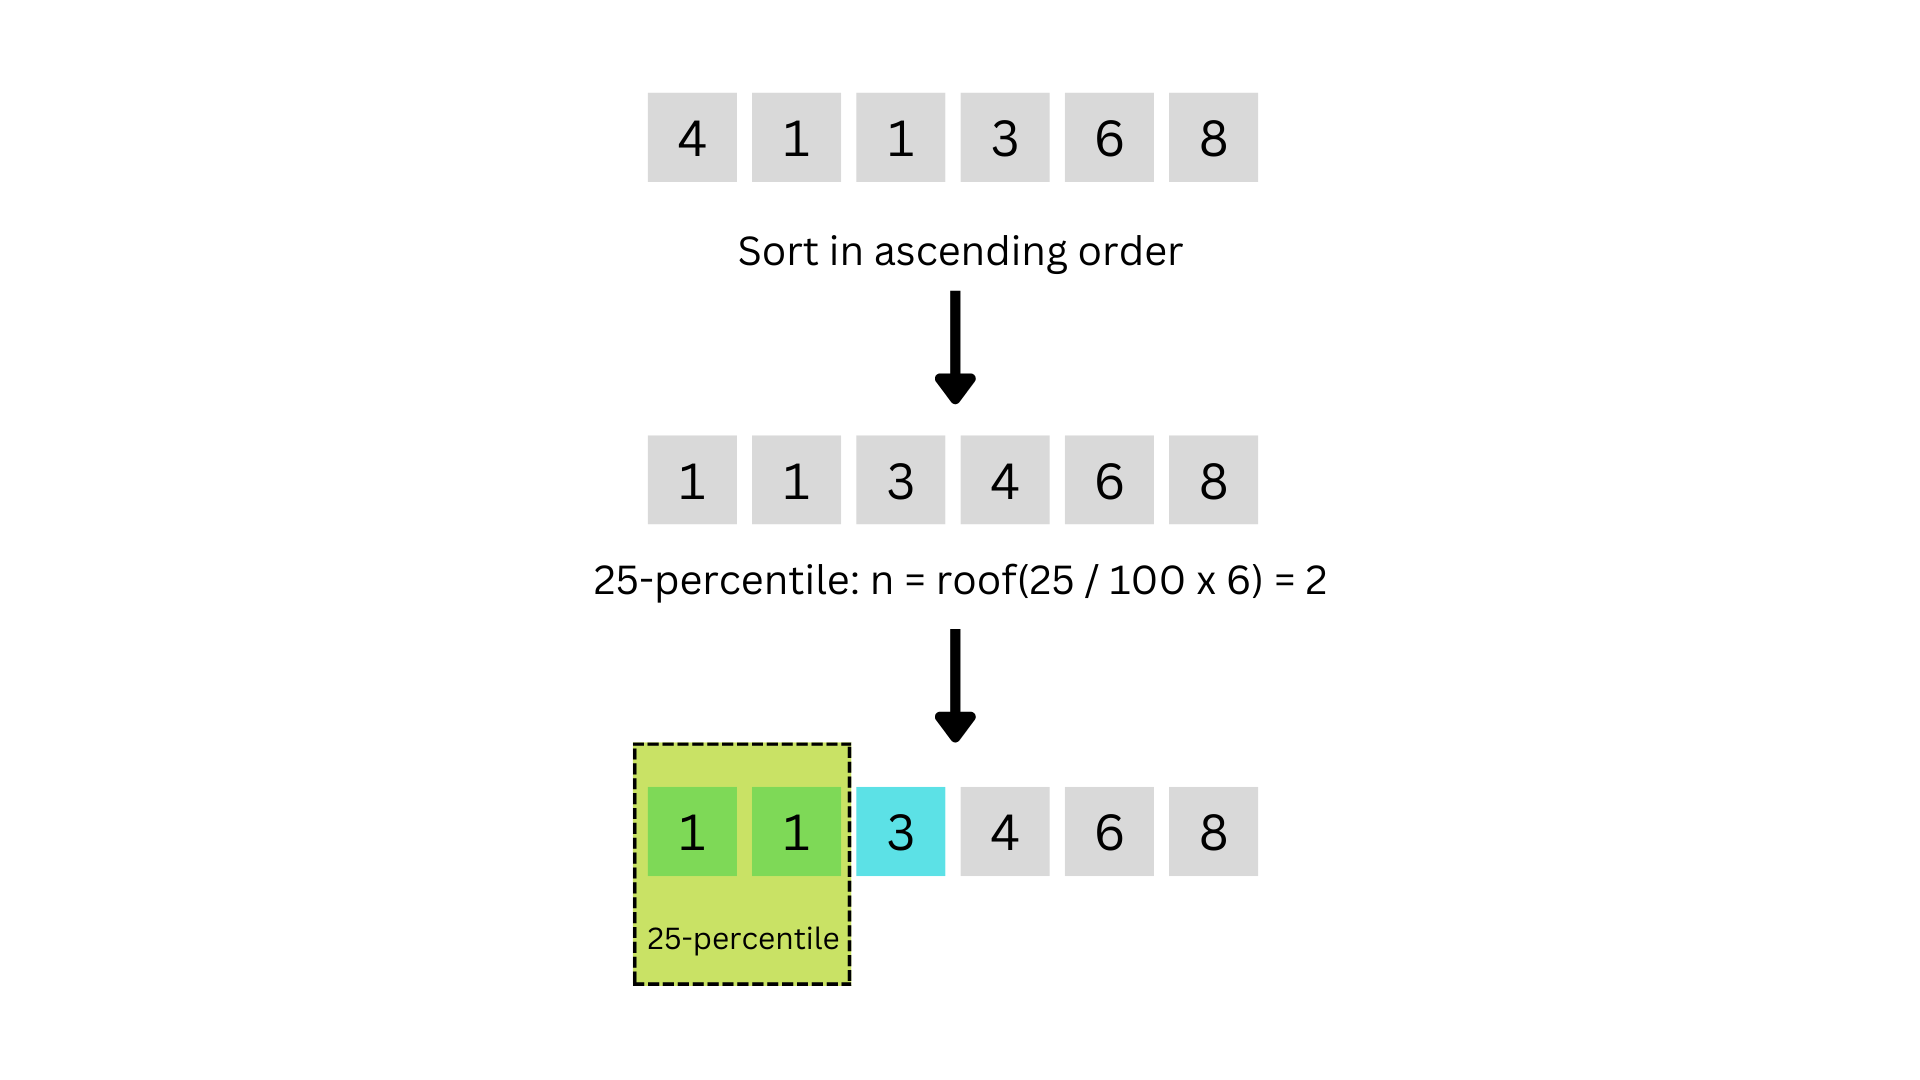
Maybe the simplest definition is the so-called "nearest-rank" method. Where we sort our data of length \(N\) into ascending order. Then, we take the ordinal rank \[n = \left\lceil {k \over 100} \times N \right\rceil, \] this gives us the index \(n\) of the cut-off value for our percentile.
Due to the rounding, the cut-off values are not necessarily smooth. This may be problematic for certain applications.
Another popular approach is to use interpolation. With this approach, you interpolate between the adjacent values. There are different variations of how the interpolation is done. Generally, linear interpolation is used. Going through the details of different variants is outside the scope of this post. The essential numerical computation packages, which we also cover, tend to support the interpolation methods.
Test data
As usual, we will need some test data to start our experiments with percentiles. To make things simple, we use normally distributed data with zer0 mean and unit deviation. This makes it easy to interpret and compare the results.
In the following, we generate the test data set. We utilize numpy to draw samples from the normal distribution.
import numpy as np

mean = 0 # zero mean
deviation = 1 # unit standard deviation
samples = 10000 # number of samples in the test data set

data = np.random.normal(mean, deviation, samples)
To verify the correctness of the data, we can simply plot the histogram and see what it looks like.
import matplotlib.pyplot as plt

plt.hist(data, bins=100)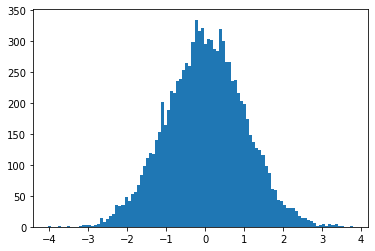
Looks more or less like a normally distributed random variable. So we are good to proceed.
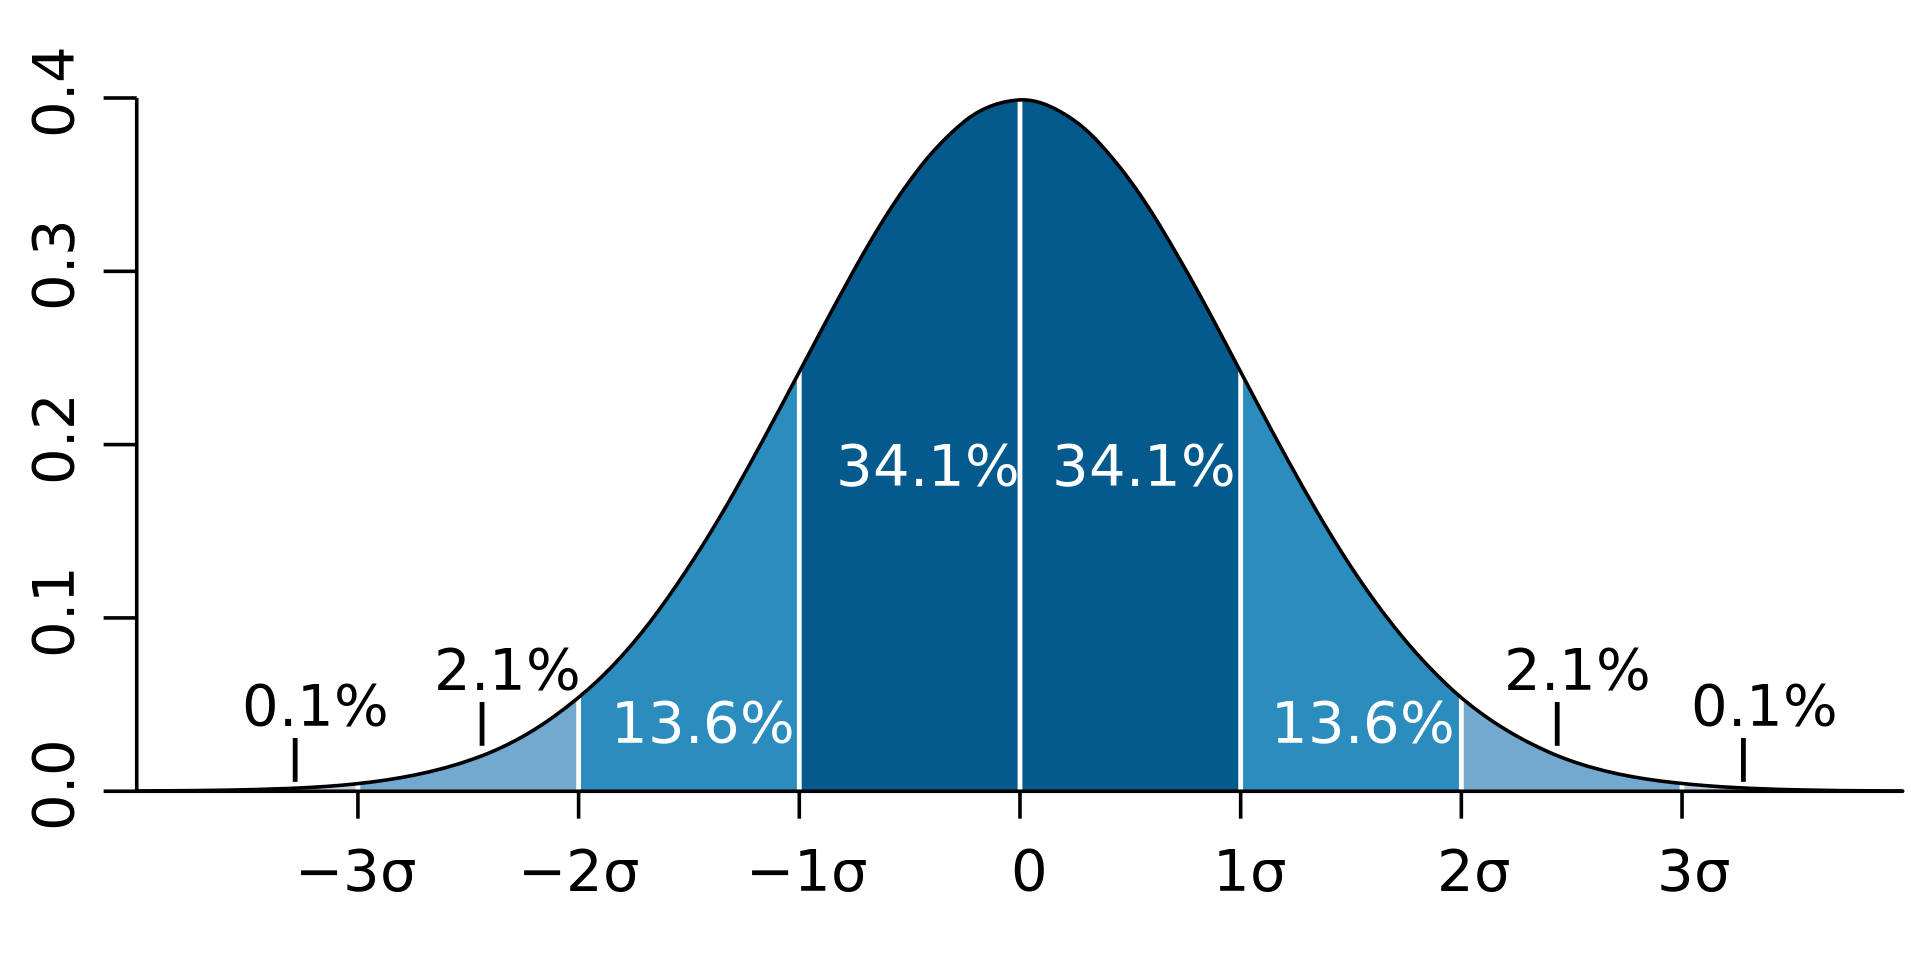
Next, we should determine, what to expect from our test data. Looking at the first percentiles picture, 68.2% percent of the samples should fall within the range \([-\sigma, \sigma] = [-1, 1]\). Following the distribution symmetry, 68.2% of the absolute values of the samples should be less than \(\sigma = 1\).
Similarly, \(68.2\% + 2 \times 13.6\% = 95.4\%\) of the absolute values of the samples should be less than \(2\sigma = 2\).
Now that we know what to expect, we can start testing different packages to calculate the percentiles.
NumPy
NumPy is of course our go-to package for any numerical computations. It also includes the percentiles method, which is really quite convenient to use. You can find it from numpy.percentile or np.percentile when using the conventional alias.
NumPy has support for 9 different methods for calculating percentile. These are set by using the method attribute. Linear is the default method. This references linear interpolation, as discussed above. Linear approximation is fast and provides reasonable results for most scenarios. In addition wide category of interpolation methods. There is also, which takes the closest value. This method would be closer to the simple nearest-rank method as discussed in the previous section.
Without going too deep into the NumPy internals. Let's see how calculating percentiles actually works with it. Let's first calculate the 68.2% percentile of our test data. From the data, we would expect this to be close to 1.
import numpy as np

p = np.percentile(np.abs(data), 68.2)

print("Percentile score", p)
The result of my test run was 1.004291475264509
We can also verify this in the reverse direction by calculating how many samples are below 1.004291475264509.
np.sum(np.abs(data) < 1.004291475264509) / len(data) * 100This gives us exactly 68.2%. So far np.percentile is working exactly as expected. Next, we can test with the 95.2% percentile, which should be close to 2.
import numpy as np

p = np.percentile(np.abs(data), 95.2)

print("Percentile score", p)
This gives us 2.0267407062987757. Close enough, with the relatively small amount of samples that we have.
SciPy
If you need to go beyond the abilities of NumPy and you're using SciPy, you may want to look into the scipy.stats package for percentile calculation. SciPy implements percentiles with the method scipy.stats.scoreatpercentile.
The basic usage is very similar to the np.percentile. You provide it input in array format and the desired percentile. The method returns the corresponding percentile score.
import scipy.stats

p = scipy.stats.scoreatpercentile(np.abs(data), 68.2)

print("Percentile score", p)
This returns 1.004291475264509, which matches our result from NumPy. If you want to go in the reverse direction. There is a handy function in SciPy scipy.stats.percentileatscore.
import scipy.stats

p = scipy.stats.percentileofscore(np.abs(data), 1.004291475264509)

print("Percentile", p)
This gives us back the 68.2%, as expected.
Pandas
The last library that we take a look at is Pandas. If you are dealing with statistical data in a table format, the changes are that you are already using Pandas. Pandas support computing percentile via quantile method, which is readily available for pandas Series.
In Pandas, we need to make sure that we are working with Pandas' native data formats. We need to convert our data set into pandas.Series and utilize the quantile method. This takes the percentile as a fraction instead of a percentage. That is, for 68.2% percentile, we pass 0.682.
import pandas as pd

series = pd.Series(np.abs(data))

p = series.quantile(68.2 / 100)

print("Percentile score", p)In our case, this prints out 1.004291475264509, which again matches the expected and previous results.
Custom percentiles implementation
If you are in an environment, where none of the aforementioned libraries are available, then you may need to implement percentiles computation yourself. Changes are that your implementation will be slower than the ones that are provided in the numerical computation packages, but sometimes it's the only option.
One of the easiest ways to do this is to utilize the nearest-rank method as discussed at the beginning of the post. With this approach, we have the following steps:
- Sort the data in ascending order
- Choose the index that corresponds to the given percentile
This is likely not the most efficient way as sorting tends to be quite a computationally heavy process, but it gets to job done.
import math

def percentile(input, q):
    data_sorted = sorted(input) # Sort in ascending order

    index = math.ceil(q / 100 * len(data_sorted))

return data_sorted[index]Similarly, to the previous examples, we will use the absolute values of the normally distributed data to verify our results.
data_abs = [abs(d) for d in data] # Convert to the absolute values

p = percentile(data_abs, 68.2)

print("Percentile score", p)
This gives us 1.0044024028260983, as expected.
Notice how simple the nearest-rank method was to implement. You could easily squeeze this into a oneliner.
Summary
Calculating percentile in Python is relatively straightforward. Percentile is an important tool in statistics, and all the essential numerical & statistical computation libraries have support for percentile. Even implementing it yourself without any assistance from external Python libraries is easy if we are willing to sacrifice some performance.
Hopefully, you had fun going through the different approaches to calculating percentiles in Python. For a further and deeper dive into the topic, check the Wikipedia page below.
Further reading and references
 Contributors to Wikimedia projects
